

Measuring Sales Performance Beyond Win Rates
- Avner Baruch
- Sep 13, 2025
- 3 min read

Updated: Feb 4
Sales organizations often rely on lagging indicators like win rates or total revenue to evaluate performance. The problem? By the time those numbers surface, it’s too late to course-correct. That’s like waiting until the end of the season to tell a baseball player how to swing.
Project Moneyball offers a different approach: measure performance across key milestones in real-time instead of waiting for deals to close. This way, we compare how reps perform against the proven pace of A-Players, the top performers who set the standard.

The Core Idea
Every sales cycle is made up of measurable steps. If we track the time it takes to move through those steps, we can spot bottlenecks, coach in the moment, and keep deals moving.
Instead of only looking at Z* — the full sales cycle — we also measure:
X* = Time from the Intro Call to the Business Case (building a joint business case with stakeholders).
Y* = Time from the Intro Call to the Technical Win (when stakeholders agree on projected value after a technical demonstration).
Z* = The total Sales Cycle, from Intro Call to Close Won.


Benchmarking Against A-Players
The power of this system comes from comparison. Each milestone isn’t just measured in isolation — it’s measured against A-Player averages:
X = Average number of days A-Players take to build a business case (e.g. 15 days in the example above)
Y = Average number of days A-Players take to secure a technical win (e.g. 40 days in the example above)
Z = Desired number of days for A-Players to close a deal (e.g. 90 days in the example above)
By comparing reps’ performance to these benchmarks, we measure execution quality and not just outcomes, and that allows us faster response (coaching, feedback, fine-tuning our GTM playbooks).
Why This Matters
Early Intervention - If a rep consistently lags behind at X*, managers know to coach around stakeholder alignment before the deal goes cold.
Pattern Recognition - Over time, organizations can see whether delays come from systemic challenges (like product positioning) or individual skills.
Predictability - When X* and Y* are met consistently, the likelihood of hitting Z* increases, making forecasting sharper.
Fair Comparisons - Rather than judging reps only by “closed revenue,” you evaluate them on how efficiently they advance through critical milestones.
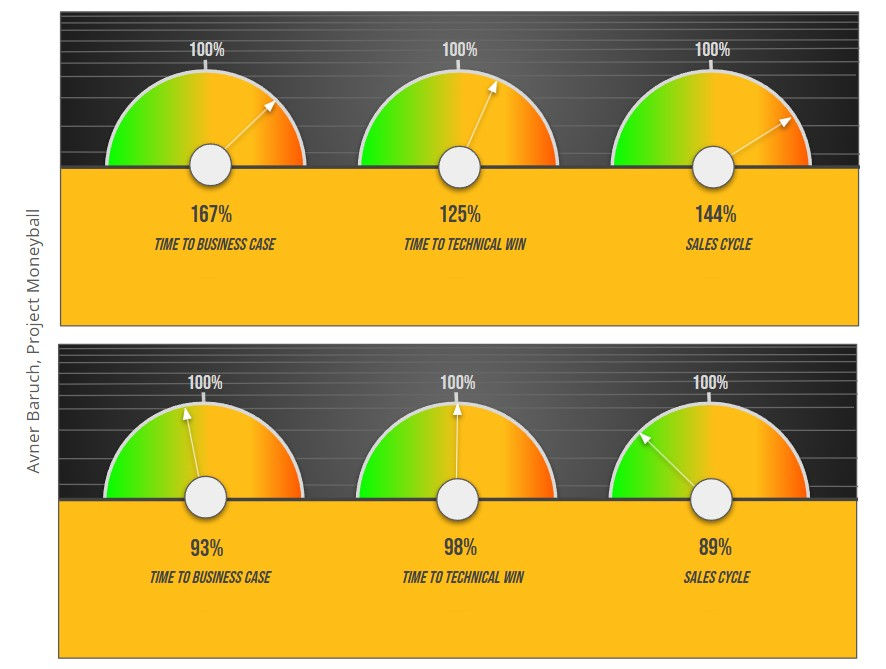
Let’s break it down:
In the example above, we see two dashboards.
The top dashboard shows the performance of a Core Rep. As the graphs indicate, this rep is moving slower than our benchmark (set at 100%). In fact, their sales cycle is 144% longer than the benchmark.
The bottom dashboard shows an A-Player. Here, the graphs tell a different story: this rep is moving faster than the benchmark, consistently outpacing expectations.
From Post-Mortem to Real-Time Coaching
Most companies wait until deals are lost to analyze what went wrong. By then, the insights are stale. Project Moneyball shifts this dynamic to real-time coaching:
Managers can spot where deals are stuck.
Reps can self-diagnose by comparing their numbers against A-Players.
Enablement teams can create targeted interventions for specific milestones.
Final Thought: Surgical Adoption Over Lagging Indicators
In today’s market, no business can afford to wait for lagging indicators like win rates to reveal what went wrong. By then, the opportunity has vanished, competitors have moved faster, and the window to influence outcomes has closed.
That’s why Project Moneyball emphasizes surgical adoption metrics — milestone-level insights that capture execution quality in motion. Measuring X*, Y*, and Z* gives leaders the precision to adjust strategy mid-cycle, not post-mortem.
The result is faster alignment, sharper execution, and stronger competitiveness in an environment where speed and adaptability decide winners.
Because in today’s dynamic markets, the companies that win aren’t the ones that wait — they’re the ones that measure, adapt, and act in real time.

Founder, Author, Auditor


Comments